
2021 performance
One P&L
For full reconciliation from statutory to non-GAAP measures, please refer to Note 26 and the unaudited preliminary results published on 6 May 2022.
- Billings is gross billings to clients including pass-through costs.
- Like-for-like is a non-GAAP measure related to 2020 being restated to show the unaudited numbers for the previous year of the existing and acquired businesses consolidated for the same months as in 2021 applying currency rates as used in 2021.
- Pro-forma numbers relate to unaudited full year non-statutory and non-GAAP consolidated results in constant currency as if the Group had existed in full for the year and have been prepared under comparable GAAP with no consolidation eliminations. Consequently the prior year comparatives will change year on year.
- Operational EBITDA is EBITDA adjusted for non-recurring items and recurring share-based payments and is a non-GAAP measure management uses to assess the underlying business performance. Operational EBITDA margin is operational EBITDA divided by gross profit.
- Operational EBITDA margin is operational EBITDA divided by gross profit.
- Adjusted operating profit is operating profit/loss adjusted for non-recurring items and recurring share-based payments.
- Adjusted result before income tax is profit/loss before income tax adjusted for non-recurring items and recurring share-based payments.
Our four
core principles
* Faster, Better, Cheaper
We are
purely digital
Holy Trinity of :
First-party data
Digital content
and Digital media
Speed
Quality
Value*
With a
unitary
structure
One world,
one business

Pro-forma gross profit/net revenue by region
Pro-forma gross profit/net revenue by practice
One direction
- January: Announcement of combination between Media.Monks and 4 Mile Analytics.
- January: Announcements of combination of MediaMonks with TOMORROW and STAUD STUDIOS.
- February: MightyHive acquired the assets of Datalicious Australia.
- March: Announcement of conditional agreement to combine MediaMonks and Jam3, completed in May.
- May: Announcement of agreement to combine MightyHive and Raccoon.
- July: Announcement of combination of Destined and MediaMonks.
- August: MediaMonks and MightyHive become one unitary brand: Media.Monks.
- September: Announcement of combinations of Cashmere and Zemoga with Media.Monks.
- November: Announcement of combination of Miyagi and Media.Monks.
- December: Announcement of combination of Maverick and Media.Monks.
- January: Announcement of combination of MediaMonks with Circus Marketing.
- May: Announcement of combination of MightyHive with Digodat.
- June: Announcement of combination of MightyHive with Lens10.
- July: Announcement of combination of MightyHive with Orca Pacific.
- August: Announcement of combination of MightyHive with Brightblue.
- September: Announcement of combination of MediaMonks with Dare.Win.
- December: Business combinations of MediaMonks with Decoded and MightyHive with Metric Theory.
- April: Caramel Pictures acquired by MediaMonks.
- April: Combination of MightyHive with ProgMedia.
- June: Announcement of combination of MediaMonks with BizTech.
- August: Combination of MediaMonks with IMA.
- October: Combination of MediaMonks with Firewood Marketing.
- October: Combination of MightyHive with ConversionWorks.
- November: Announcement of combination of MediaMonks with WhiteBalance.
- May: Formation and initial funding of S4Capital plc.
- July: Combined with digital content production company MediaMonks.
- December: Combined with programmatic company MightyHive.
Dear
shareowner
In our third full financial year we almost doubled in size and generated over $900 million (£687 million) of revenue. We continued to develop client conversion at scale to achieve our ultimate 202 objective: 20 clients each generating revenues of over $20 million (£15.3 million) per annum over the period 2022-24.
- We continued to broaden and deepen our Content and Data&Digital Media practices through organic growth and by the addition of a further five Content, four Data&Digital Media and one Technology Services companies in 2021 and one so far in early 2022.
- We expanded into our third practice area – Technology Services – enabling us to engage more deeply with CIOs and CTOs in addition to CMOs, Chief Sales Officers and CDOs.
- We introduced our single operating brand, Media.Monks, reflecting our seamless, fully integrated offer for clients.
- We expanded our major client relationships and broadened and deepened our client roster.
- We appointed a global Chief Diversity Officer and continued to embrace our diversity, equity and inclusion opportunities with unique, black-orientated fellowship and female executive leadership programmes, changed hiring practices and education programmes.
- We continued to make progress in our zero carbon commitments targeting 2024, earlier than most.
- We have currently achieved double $ and close to double £ Unicorn status in terms of stock market value, in only our third full year, despite the significant stock market volatility, while expanding our balance sheet to take advantage of combination opportunities.
Financial
performance
All-in-all, we continued to fire on almost all cylinders in 2021, with like-for-like revenue and gross profit/net revenue up 52.4% and 43.7%, two-year simple stacks for gross profit/net revenue up 63.1%, the one feature we would have liked to improve on being the Operational EBITDA margin, which was impacted by the significant investment required to bed down our growth.
Geographic
performance
On a pro-forma basis, The Americas accounted for 71.3% of gross profit against 74.3% in 2020. Europe, Middle East & Africa represented 19.4% of gross profit against 16.6% in 2020. Asia Pacific represented 9.3% of gross profit against 9.1% in 2020. Pro-forma growth in gross profit/net revenue was up 39.9% in The Americas, 70.8% in Europe, Middle East & Africa and 47.8% in Asia Pacific.
Pro-forma gross profit/net revenue by region
Practice
performance
On a pro-forma basis, Content accounted for 67.0% of gross profit/net revenue against 65.5% in 2020. The Data&Digital Media practice represented 29.6% of gross profit/net revenue against 31.8% in 2020. Technology Services, a new practice for us in 2021, accounted for the remaining 3.4%. Pro-forma growth in gross profit/net revenue was up 49.0% at the Content practice and up 36.0% at the Data&Digital Media practice. Technology Services was up 79.3%.
Pro-forma gross profit/net revenue by practice
Note
Pro-forma numbers relate to unaudited full year non-statutory and non-GAAP consolidated results in constant currency as if the S4Capital Plc Group (the Group) had existed in full for the year and have been prepared under comparable GAAP with no consolidation eliminations.
ESG:
Environment, Social and Governance strategy
O
We have a firm belief that creativity and technology are a force for good and powerful tools required in the transition towards a more sustainable society
O
Our ESG
strategy
Our ESG strategy, comprising three pillars, is based on our potential impact, stakeholder opinions and our contribution to the Sustainable Development Goals (SDGs) developed in 2015 by the United Nations.
- Zero Impact Workspaces concentrates on our own operations.
- Sustainable Work focuses on our work for and with clients.
- Diversity, Equity and Inclusion (DE&I), focuses both on our own workplace, with a growing emphasis on the support we offer to clients.
How we create value with our strategy and contribute to the SDGs. The impact model (below) explains how our sustainability strategy, our activities and the resources we use, lead to our ultimate impact goal. It describes how we create added value, not only now, but also in the long term. As shown in the model, we aim to contribute to the SDGs.
Our impact
model
Input
People
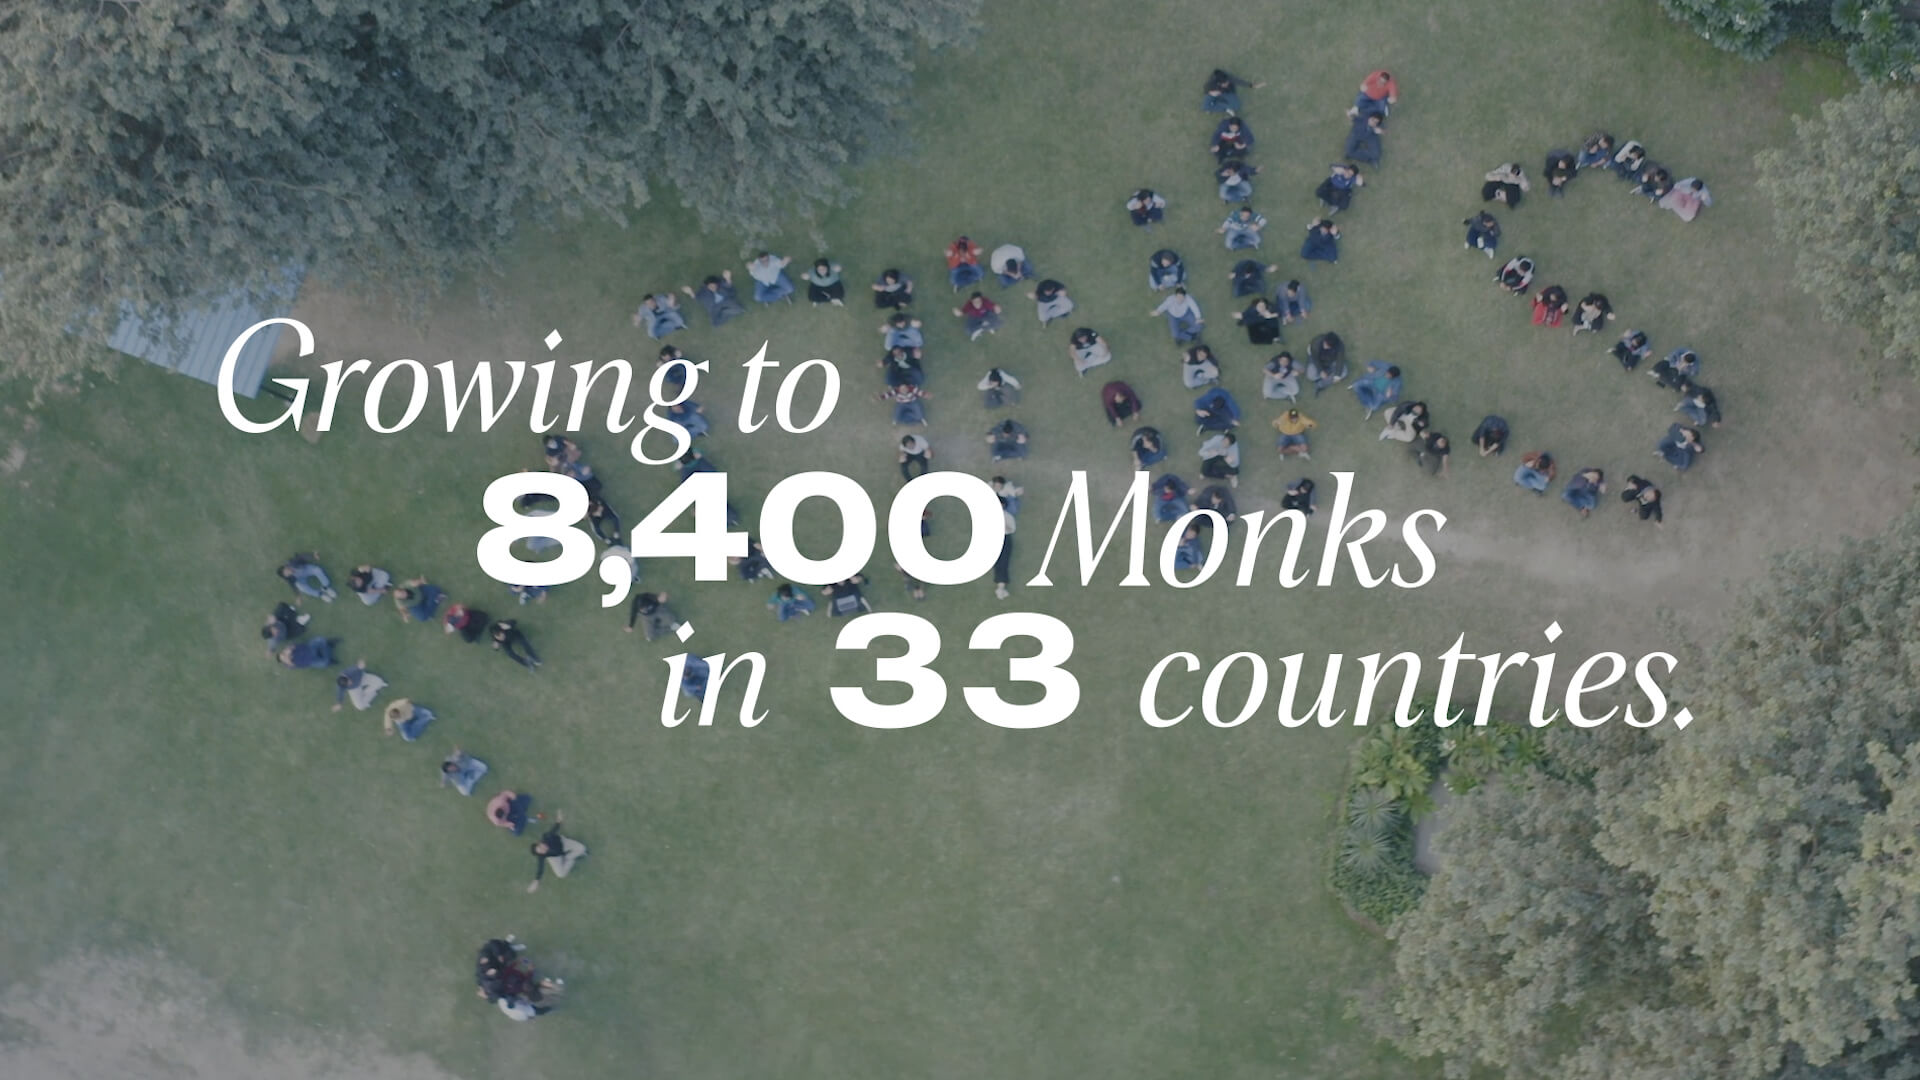
- 5,874 employees
- >20 countries
- 43% women,
44% men,
13% undeclared
Resources
- >30 offices
- 2,397.97 MWh electricity used
Financial capital
- 0.07% of revenue invested in innovation
Relationships
- Clients
- Business partners
- Charities
Business model
Our vision
Creativity and technology are a force for good and powerful tools required in the transition towards a more sustainable society
Our ESG mission
We are a catalyst for the sustainable impact of our clients
Our strategy
- Zero Impact Workspaces
- Sustainable Work
- Diversity, Equity & Inclusion
Output
- Many of our people trained on diversity equity & inclusion
- Offered 66 intern positions
- 30% of electricity use is renewable
- 0.86 tonnes of CO2 emissions per FTE
- 29% of waste is recycled
- £87,091 (0.02% of net revenue) and 1,460 hours donated to charities
- [14,311] projects for clients
- 251 Projects For Good
Long-term value
-
We empower our people to be a catalyst for change, in an inclusive, diverse and creative workplace
-
We create a climate-neutral and environmentally conscious business operation
-
We remain economically viable and invest in our innovations to enable us to contribute to sustainability challenges in the long run
-
We improve the sustainable impact of our clients – to bring about the shift in attitudes and behaviour needed to reach the SDGs
Zero Impact Workspaces


Sustainable Work


Diversity, Equity & Inclusion


Note:
The reporting scope for the sustainability information is based on combinations before 2021. The activities of the following companies are included in the reporting scope: Biztech, Circus Network Holding, Decoded Advertising, Firewood, IMAgency, MediaMonks, Metric Theory, MightyHive (including Lens 10), Orca Pacific, LLC, Superhero Cheesecake BV and S4Capital.
Significant positive impact can be found in our work for clients, ranging from awareness raised on social topics to changed consumer behaviour to conservation of our environment. However, as the inputs show, we also need natural resources to enable us to work for our clients. These resources relate to a negative impact mainly due to greenhouse gas emissions and waste associated with our business activities. We are working to decrease this negative impact of our business operations and increase our positive added value through our creative work.
A comprehensive report on the Company’s 2021 ESG performance will be available from early June 2022.
For the full Strategic Report, please download the S4Capital plc Annual Report and Accounts 2021.