2025 performance

.


Our business model

The change agent for the AI economy 

We are a digital-first marketing and technology company that disrupts analogue models by accelerating and automating the way work is done to benefit our clients and their businesses.

We amplify brand power with Real-Time Brands

By integrating our capabilities in brand-building creativity, social media and data we use real-time signals across channels to dynamically adapt creativity to improve consumer engagement and, therefore, brand power.

As an Orchestration Partner we remove complexity

We orchestrate the fragmented flow of work across tools, agencies and processes to improve speed, quality and ensure brand safety. With a combination of AI workflow and studio tools, we make more of the right work, faster, better, cheaper and more.

We turn spend into growth as the Media Acceleration Partner

We connect real-time intelligence, scalable content, deep platform expertise, holistic measurement and experience optimisation into one integrated system. We accelerate the entire growth engine – turning media investment into measurable, compounding business impact.

We enable Digital Business Transformation

Our Technology Services and Consulting capabilities help transform our clients’ legacy operating and marketing models via data optimisation and management, tech stack integration, digital consumer experiences and other aspects of harnessing technological innovation.

Our tools

  • 3 circles

    One P&L and one operating model

  • 4 dots with a circle

    Data, media, content, technology and ESG integrated

  • globe

    Global scale, local relevance, sustainable impact

  • 3 stars

    AI enabled by Monks.Flow

  • 2 people icon

    Borderless talent, diverse perspectives

  • attachment icon

    Technology partnerships, investor relationships

Worldwide presence

We’re always on. A global communications business for the new marketing age. Integrated, agile and responsive.

  • 6345 People
  • 33 Countries
  • 40 Offices
  • 1 Unitary structure
Global map
  • Company Locations

Financial highlights

  • Billings¹

    £1.9bn

    -2.6%

    Like-for-like² +0.4%

  • Revenue

    £754.8m

    -11.0%

    Like-for-like -8.7%

  • Net revenue

    £673.0m

    −10.8%

    Like-for-like -8.4%

  • Dividend per share

    1.1p

    2024 1.0p

  • Operational EBITDA³ ⁴

    £81.2m

    −7.5%

    Like-for-like -3.2%

  • Operational EBITDA margin³

    12.1%

    +50bps

    Like-for-like +70bps

  • Operating profit

    £2.7m

    2024 -£302.8m loss

  • Loss before income tax

    -£23.8m

    2024 -£330.9m

  • Adjusted operating profit⁶

    £74.0m

    −5.5%

    Like-for-like -0.9%

  • Basic loss per share

    -3.7p

    2024 -45.7p

  • Share price at 23 March 2026

    20.5p

  • Market capitalisation at 23 March 2026

    £137m

  • Adjusted result before income tax⁵

    £47.5m

    −5.4%

  • Net debt/operational EBITDA

    1.1x

  • Net debt

    £86.9m

    2024 £142.9m

  • Adjusted basic earnings per share

    5.0p

    2024 5.2p

For full reconciliation from statutory to non-GAAP measures, please refer to the Alternative Performance Measures Appendix on page 175 of the 2025 Annual Report and Accounts.

  1. Billings is gross billings to clients including pass-through costs.
  2. Like-for-like relates to 2024 being restated to show the unaudited numbers for the previous year of the existing and acquired businesses consolidated for the same months as in 2025, applying currency rates as used in 2025.
  3. Operational EBITDA margin is operational EBITDA as a percentage of net revenue.
  4. Operational EBITDA is EBITDA adjusted for acquisition related expenses, non-recurring items (primarily acquisition payments tied to continued employment, amortisation and impairment of business combination intangible assets and restructuring and other one-off expenses) and recurring items (share-based payments), and includes right-of-use assets depreciation. It is a non-GAAP measure management uses to assess the underlying business performance.
  5. Adjusted result before income tax is profit/loss before income tax adjusted for non-recurring and recurring items (as defined in footnote 4).
  6. Adjusted operating profit is operating profit/loss adjusted for non‑recurring and recurring items (as defined in footnote 4).

Business summary

Throughout 2025, our trading reflected the continuing impact of increasingly volatile global macroeconomic conditions, heightened by tariff negotiations and increasing geopolitical risks.

Performance strengthened in the second half, supported by the phasing of new business wins and expanding relationships with major enterprise clients.

AI capability is becoming more central to the agency’s way of working and new business efforts. In this regard, the Company’s early adoption of AI and proactive approach to staff training are beginning to pay off.

Clients are expected to remain cautious in the near term due to macroeconomic uncertainty, evolving tariff dynamics, the conflict in the Middle East, and shifting technology priorities toward AI capex rather than marketing. Despite this, the Company remains confident in its strategy, business model, talent, and scaled client relationships, positioning it for sustainable long-term growth.
 

Financial summary

Despite the challenging backdrop and usual seasonal weighting to the second half, liquidity and cashflow improved significantly year-on-year, driven by disciplined cost control and strong working capital management, resulting in a substantial reduction in net debt over the course of the year.

  • Reported billings1 £1,912.9 million, down 2.6% and up 0.4% like-for-like. 
  • Reported net revenue2 down 10.8%, 8.4% like-for-like3
  • Reported operational EBITDA4 £81.2 million down 7.5%, 3.2% like-for-like. 
  • Operational EBITDA margin 12.1%, up 50bps against prior year. 
  • Year end net debt5 at £86.9 million, below targeted range of £100 million to £140 million with leverage improved to 1.1x net debt/operational EBITDA. 
  • Subsequent to the year end the Company repurchased €25.7 million of its €375 million Term Loan B at a discount. 
  • The Board proposes a final dividend of 1.1p per share, a 10% increase compared to prior year.
  1. Billings is gross billings to clients including pass through costs. 
  2. Net revenue is revenue less direct costs. 
  3. Like-for-like is a non-GAAP measure and relates to 2024 being restated to show the audited numbers for the previous year of the existing and acquired businesses consolidated for the same months as in 2025 applying currency rates as used in 2025. 
  4. Operational EBITDA is operating profit or loss adjusted for acquisition related expenses, non-recurring items (primarily acquisition payments tied to continued employment, amortisation and impairment of business combination intangible assets and restructuring and other one-off expenses) and recurring items (share-based payments) and includes right-of-use assets depreciation. It is a non-GAAP measure management uses to assess the underlying business performance. Operational EBITDA margin is operational EBITDA as a percentage of net revenue. 
  5. Net debt excludes lease liabilities. 
  • Billings £m

  • Revenue £m

  • Net revenue £m

  • Operational profit /(loss) £m

  • Adjusted operating profit £m

  • Operational EBITDA and margin £m

Net revenue split by practice %

  • Marketing Services (MS)

    91.2

  • Technology Services (TS)

    8.8

Net revenue split by region %

  • Americas

    79.9

  • EMEA

    14.8

  • APAC

    5.3

Sustainability

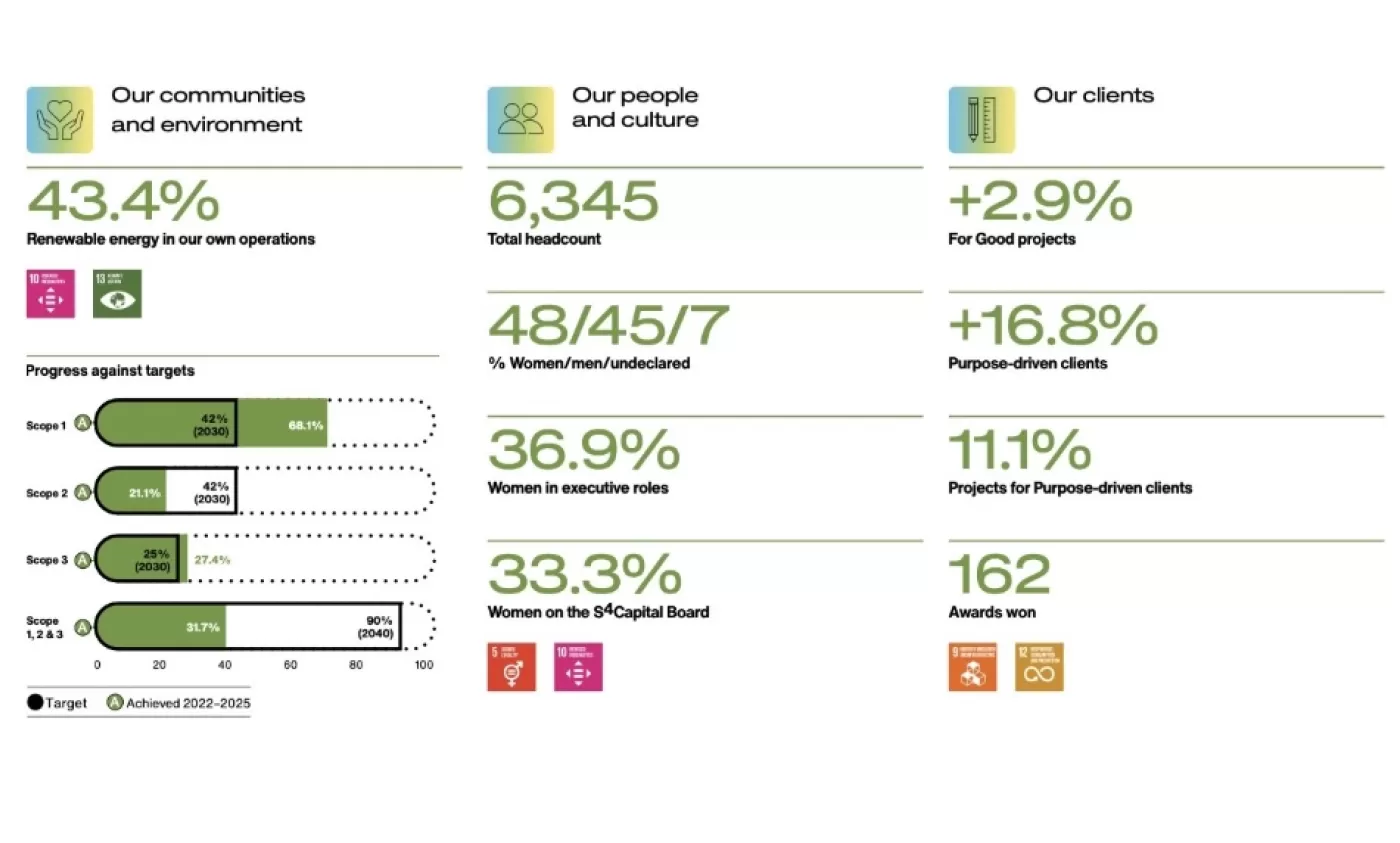
We continue to bring ESG into our decision making, ensuring the technology and creativity we deploy create value for our clients and contribute positively to people and the planet.

Our ESG strategy is built upon three foundational pillars: Our Responsibility to the World, People Fulfilment and One Brand. Below are 2025’s highlights, achieved together with several of our stakeholders: our communities, our people and our clients.

report